From recorded use to an admissible estimate.
The application opens on the estimated effect and causal ROI. Its Measurement Contract, DAG, diagnostics, and interpretation remain available as separate inspectable views.
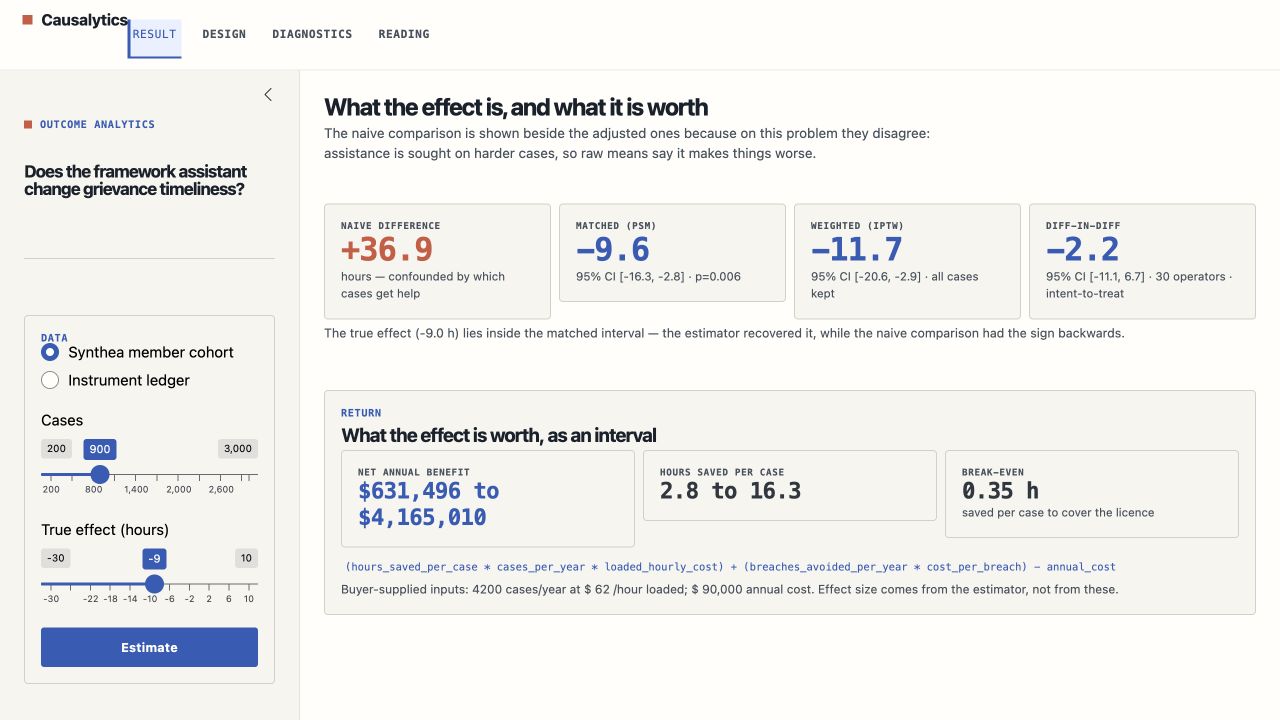
This is the working Result view, not a mockup. The model interprets the computed result only. It does not select covariates, calculate estimates, relax thresholds, or decide whether a claim is permitted.
From operational evidence to a causal claim
Visits completed, cases processed, documents reviewed, response times, adoption, and reported hours saved are useful measures. On their own, they do not establish whether an intervention produced the outcome or what would have happened without it.
Causalytics assigns each result a claim level supported by its evidence:
OPERATIONAL
What happened?
Descriptive measures report adoption, throughput, timeliness, quality, cost, and outcomes. They establish operating performance without claiming attribution.
COMPARATIVE
What changed relative to a credible alternative?
Approved quasi-experimental designs use longitudinal, phased, or matched comparisons when their assumptions can be examined and defended.
EXPERIMENTAL
What was caused under randomized assignment?
When feasible and ethical, individual, cluster, or phased randomization provides the strongest basis for estimating an intervention effect.
The Measurement Contract
The Measurement Contract is a machine-readable pre-registration for an intervention evaluation. It defines what must be recorded, how the effect will be estimated, when the estimate must be withheld, and how ROI will be valued before results are examined.
Causal question
The intervention, population, outcome, time horizon, estimand, and decision the estimate must inform.
Exposure and versions
Who encountered the instrument, when exposure began, which workflow and model version operated, and whether use matched the intended treatment.
Comparison design
Randomized assignment, phased rollout, difference in differences, interrupted time series, matching, weighting, or another justified counterfactual strategy.
Outcomes and data
Primary and secondary outcomes, data provenance, measurement timing, missingness, required covariates, quality checks, and retention boundaries.
Assumptions and uncertainty
Identification assumptions, diagnostics, sensitivity analysis, precision, threats to validity, and the conditions under which the claim must be narrowed.
Distribution of effects
Pre-specified subgroup and equity analysis, including the limits imposed by sample size, measurement quality, and multiple comparisons.
Cost and ROI
Implementation, operating, transition, and oversight costs, attributable benefits, valuation rules, observation window, and approval of the final calculation.
Claim threshold
The minimum sample, comparison quality, overlap, balance, and other evidence required to report operational improvement, comparative effect, causal effect, savings, or return on investment.
The contract is executable
The reference implementation does not treat the Measurement Contract as documentation. It drives both the instrument and the analysis.
CAPTURE
Record context before assistance
The contract tells the instrument which confounders must be captured at intake, before AI assistance can affect them. Queue depth and organizational facts are recorded when the case opens rather than reconstructed later.
REFUSE
Withhold unsupported estimates
Missing required fields, insufficient operators, poor overlap, or failed balance thresholds stop the analysis. The system reports why it cannot estimate instead of producing a number with a caveat.
TRIANGULATE
Compare methods that fail differently
The current reference contract specifies propensity-score matching, inverse-probability weighting, and operator-panel difference in differences. Disagreement is examined rather than resolved by selecting the preferred result.
The graph governs the estimate.
The application derives its adjustment set from a declared DAG. It shows what must be adjusted, which backdoor paths are closed, and why downstream variables are excluded.

Changing the graph changes the claim and requires a new Measurement Contract version.
Measurement is designed into the intervention
Causalytics does not wait until the end of an intervention to reconstruct an evaluation. The evidence plan records the operational facts needed for analysis while preserving purpose limitation and data minimization.
BEFORE RELEASE
Define the decision and baseline
Specify the intended effect, unit of analysis, eligibility, exposure, outcomes, full costs, comparison strategy, observation period, and minimum useful evidence.
DURING OPERATION
Record treatment and context
Capture intervention version, timing, adoption, exceptions, relevant context, outcomes, and costs without allowing later interpretation to rewrite the measurement record.
AFTER OBSERVATION
Estimate, challenge, and report
Run the pre-specified analysis, examine assumptions, test sensitivity, report uncertainty and subgroup results, calculate attributable value, and retain the complete analytical record.
ROI follows attribution
Reported time savings are not automatically financial return. Causalytics separates observed activity, estimated effect, valuation, and cost.
The reference implementation carries the effect confidence interval through the ROI calculation. It reports a benefit range and break-even point rather than presenting a point estimate as a promise. Buyer-supplied costs and valuation inputs are fixed in the contract before the effect is observed.
A regulated workflow as a synthetic reference
The current reference instrument demonstrates how this system applies to a synthetic regulated case workflow using public policy material. Its contract defines framework-assistant use as the intervention and hours to resolution as the primary outcome. Intake context is recorded before assistance, adoption is staggered by operator, and the analysis refuses to proceed when contracted evidence is missing.
This is one synthetic application of the method. The same causal layer can evaluate internal programs, care and access interventions, operational changes, and vendor deployments.
Evaluate one intervention and the value attributed to it.
An evaluation begins with evidence readiness and a Measurement Contract. The agreed observation period, comparison quality, and diagnostics determine when a causal or ROI conclusion is appropriate.