The one group that grew
Each March, the National Resident Matching Program (NRMP) publishes who matched into every residency specialty, broken down by applicant type: senior students at U.S. MD and DO schools, prior-year U.S. graduates, U.S. citizens who trained at medical schools abroad, and non-U.S. citizens who trained abroad. The last two groups are international medical graduates, or IMGs.
Reading the family medicine rows across the five most recent reports produces the chart below.
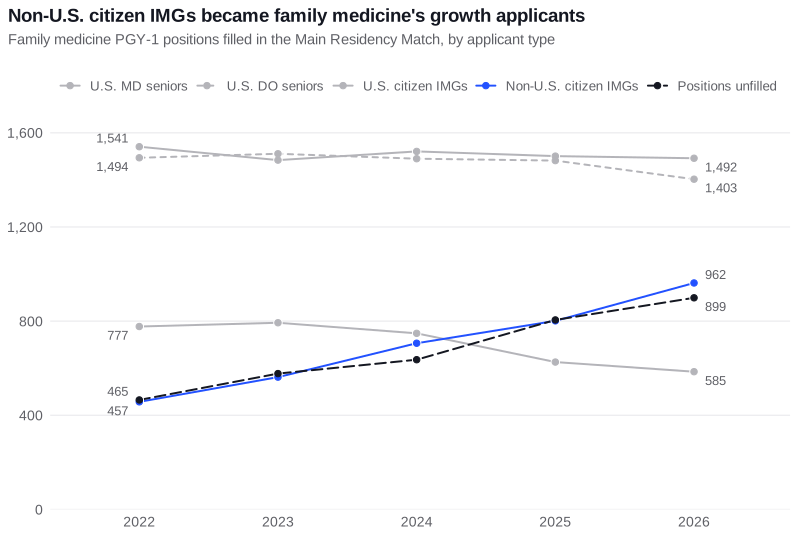
Between 2022 and 2026 family medicine programs offered 575 more positions, an 11.7 percent increase. Matches rose by only 141. Where those matches came from is the story:
- U.S. MD seniors: 1,541 to 1,492, down 49.
- U.S. DO seniors: 1,494 to 1,403, down 91.
- Prior-year U.S. MD and DO graduates: 181 to 150, down 31.
- U.S. citizen IMGs: 777 to 585, down 192.
- Non-U.S. citizen IMGs: 457 to 962, up 505.
Non-U.S. citizen IMGs were 10.3 percent of matched family medicine positions in 2022 and 20.9 percent in 2026. Unfilled positions still rose from 465 to 899, because the growth in one applicant group did not cover both the new positions and the decline in every other group.
ARITHMETIC, NOT A FORECAST
If non-U.S. citizen IMG matches had stayed at their 2022 count, and nothing else changed, 1,404 family medicine positions would have gone unfilled in 2026 instead of 899.
That figure is simple subtraction under a stated assumption. It is not a causal estimate. Other applicants might have ranked family medicine differently if fewer IMGs were competing, and programs might have offered fewer positions. It does show the scale of the dependence.
The applicants filling the gap matched at a five-year low
Match rate is the share of active applicants who matched to a first-year position. Non-U.S. citizen IMGs are the only applicant type whose rate fell in 2026: 56.4 percent, down from 58.0 percent in 2025 and the lowest since 2021. U.S. citizen IMGs reached 70.0 percent, their highest on record, and U.S. DO seniors reached 93.2 percent.
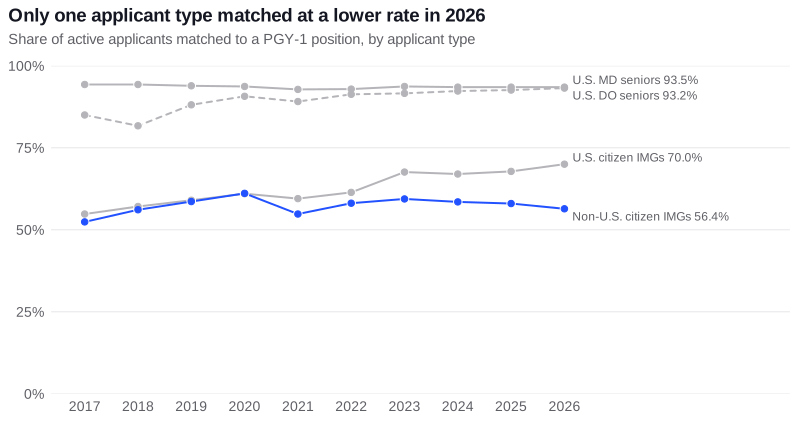
The NRMP’s announcement of the 2026 results adds a split the report tables do not: among foreign-born IMGs, those who required visa sponsorship matched at 54.4 percent, a five-year low, while those who did not require sponsorship, mainly U.S. permanent residents, matched at 67.9 percent, a five-year high. The gap between an applicant who needs a visa and one who does not was 13.5 percentage points.
The report does not say why. Active non-U.S. citizen IMG applicants increased by 479 to 11,944, so a falling rate is consistent with more applicants competing for a similar number of positions. It is also consistent with programs ranking visa-requiring applicants lower. The data here cannot separate those explanations.
A primary care pattern, not a family medicine one
Family medicine is not unusual. Across the 18 PGY-1 specialties that filled at least 200 categorical positions in 2026, the four with the highest share of IMG matches are all primary care as the NRMP defines it: internal medicine, family medicine, primary internal medicine, and pediatrics. Pathology is the one non-primary-care specialty in that range.
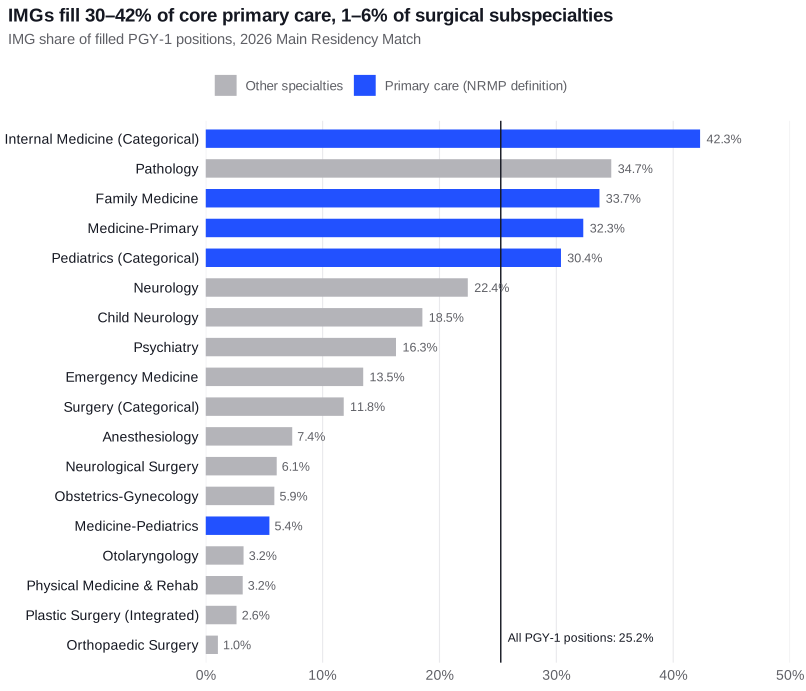
Internal medicine is the largest specialty in the Match and the most IMG-dependent: 4,508 of its 10,657 filled categorical positions, 42.3 percent, went to IMGs, and 3,448 of those to non-U.S. citizens. At the other end, orthopaedic surgery filled 963 positions and 10 went to IMGs.
Why this matters
Residency is the only path to licensure for an IMG, and family medicine and internal medicine are the residencies most likely to produce the primary care physicians that shortage-area designations are built around. A physician workforce policy that changes visa availability, J-1 waiver capacity, or the willingness of programs to sponsor is, in practice, a primary care supply policy. The figures above put a number on how much of the current pipeline that touches.
What this brief does and does not show
- Descriptive. These are counts and shares from published tables. Nothing here estimates what caused the shift, and the counterfactual figure is arithmetic under a stated assumption.
- Match, not workforce. Matching into residency is not the same as completing it, obtaining a visa, or practicing in a shortage area. Attrition and post-residency location are outside this data.
- Main Match only. The match rates exclude positions filled through the Supplemental Offer and Acceptance Program (SOAP). Some of the 899 unfilled family medicine positions were filled in SOAP; the NRMP’s report includes SOAP totals but not by specialty and applicant type.
- Citizenship, not visa status. “Non-U.S. citizen IMG” is the NRMP’s category. It includes permanent residents who need no sponsorship. The visa split is available only as two aggregate rates in the NRMP’s announcement.
- Applicant supply moved too. Some of the decline among U.S. DO seniors and U.S. citizen IMGs reflects changes in how many applied and where they ranked, not only program choices.
Data and sources
Every figure in this brief comes from the NRMP’s Results and Data: 2026 Main Residency Match (May 2026): Table 2 for 2026 matches by specialty and applicant type, Table 6 for match rates 2017–2026, and Tables 7A–7F for family medicine positions filled by applicant type 2022–2026. The visa sponsorship rates come from the NRMP’s 2026 Match results announcement (March 2026). The 2022 to 2025 family medicine unfilled counts are derived as positions offered minus positions filled by all applicants. One 2022 match in the NRMP’s small “Others” category (Canadian and Fifth Pathway applicants) explains why the five group changes sum to 142 while total matches rose by 141.
The extracted tables are available as CSV files, with the source table recorded on every row: family medicine matches, 2022–2026, IMG share by specialty, 2026, and PGY-1 match rates, 2017–2026. The charts are drawn from those files when this page is rendered.
Family medicine positions filled by applicant type, 2022–2026 (table)
| Applicant type | 2022 | 2023 | 2024 | 2025 | 2026 |
|---|---|---|---|---|---|
| U.S. MD seniors | 1,541 | 1,484 | 1,521 | 1,501 | 1,492 |
| U.S. DO seniors | 1,494 | 1,511 | 1,490 | 1,482 | 1,403 |
| Prior-year U.S. MD graduates | 87 | 90 | 68 | 90 | 96 |
| Prior-year U.S. DO graduates | 94 | 70 | 44 | 52 | 54 |
| U.S. citizen IMGs | 777 | 793 | 748 | 626 | 585 |
| Non-U.S. citizen IMGs | 457 | 562 | 706 | 801 | 962 |
| Positions unfilled | 465 | 577 | 636 | 805 | 899 |